
What the heck is EDA (Exploratory Data Analysis) Part I

In this article, I'll try to explain Exploratory Data Analysis (EDA) in a five-part series. If you’re new to EDA, I recommend reading all five of them. If you’re not, you may read through the part you’re interested.
The following are five parts:
Overview of statistics and scales of measurement
Types of data
Measures of location such as mean, median and mode.
Measures of location (percentile and quartiles) and measures of variation (range and interquartile range)
Finally, measures of variation (variance and standard deviation). Enjoy!
This part 1 is about overview of statistics and scales of measurement.
In statistics, exploratory data analysis is an approach of analyzing data sets to summarize their main characteristics, often using statistical graphics and other data visualization methods.
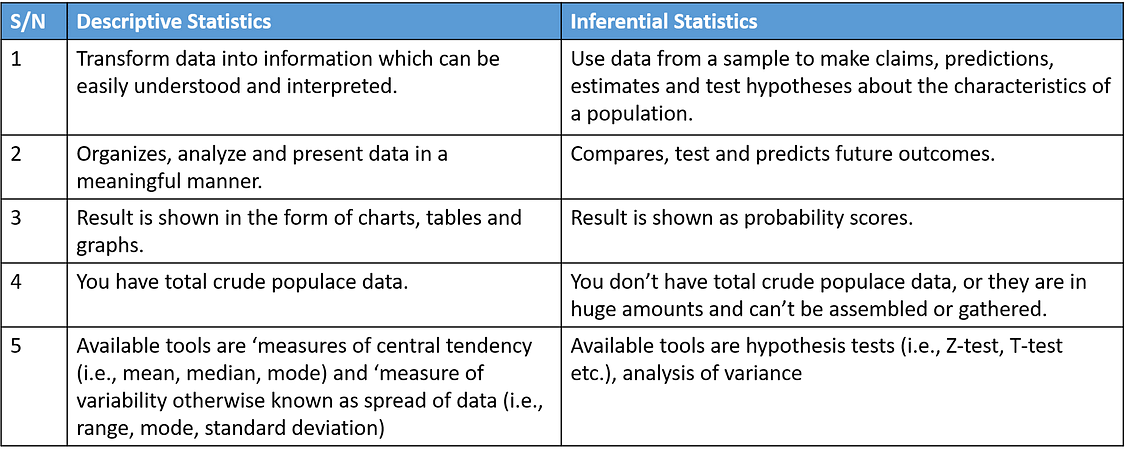
Statistics has many applications in many disciplines and can e used to predict results of an election, forecast weather, forecast sales and more. It has two main branches; descriptive and inferential statistics.
You might notice the words, populace data and sample data. Those are just jargons used by Statisticians. Population and sample are nothing but names to differential different set of data.
For example, suppose you’re working on research to know age differences between male and female students in a university. Population or population data means all students (i.e., both males and females) in that university. Can you guess what sample data means in the above example?
A sample is a subset of population that is representative of the population from which it was selected. Read the table below which i summaries it for your easy understanding.
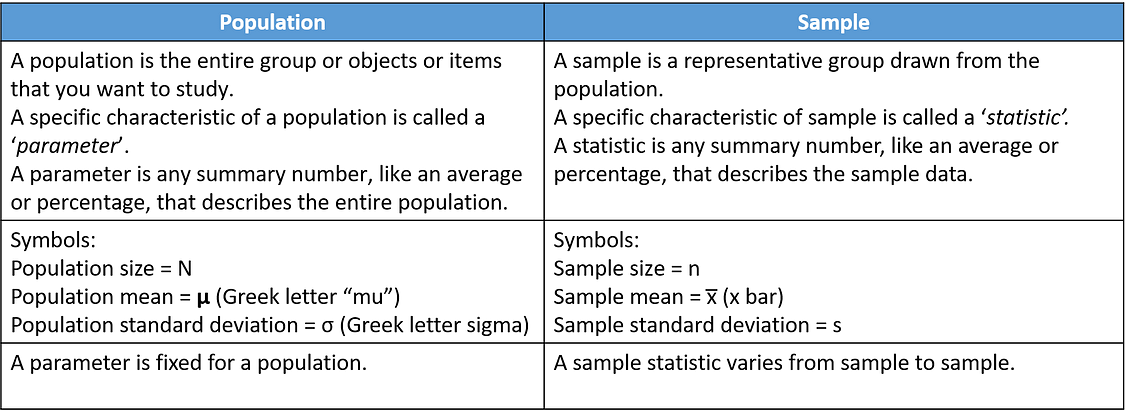
The problem is that 99.999… % of the time, we don’t — or can’t — know the real value of a population parameter. The best we can do is estimate the parameter! This is where samples and statistics come in to play.
Next, I’ll discuss about scales of measurement or level of measurements. Understanding this is important to interpreting the numbers assigned to people, objects, and events. Moreover, it’s an indicator of the most suitable data summary and statistical analysis.
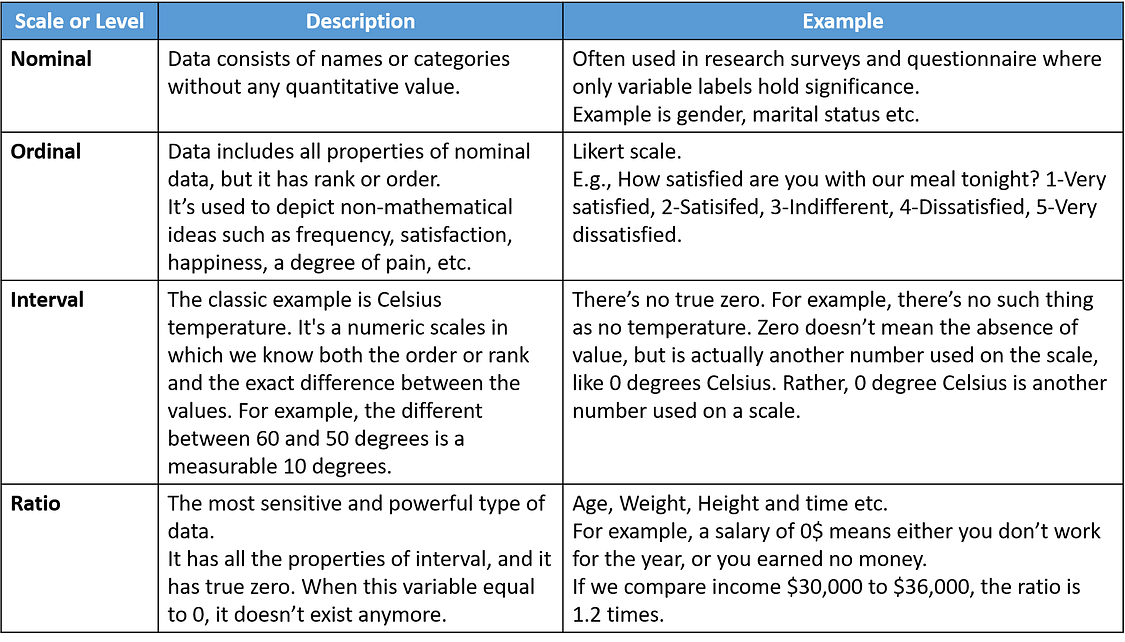
Psychologist Stanley Smith Stevens developed the best-known classification with four levels, or scales, of measurement: nominal, ordinal, interval, and ratio.
There are four scales or levels: nominal, ordinal, interval and ratio. Read the table below for your easy understanding.
This is the end of Exploratory Data Analysis Part I, Overview of statistics and scales of measurement. I hope you have a fruitful reading.
If you enjoy this article and want to read more, please support me by giving claps or responses. Thank you!
Don’t forget to check out on the next part 2 about Types of data.